
Reg
Well-Known Member
- Joined
- Nov 17, 2019
- Threads
- 55
- Messages
- 1,352
- Reaction score
- 1,635
- Location
- West Coast, The Best Coast
- Vehicles
- Taycan 4S
From the linked thread
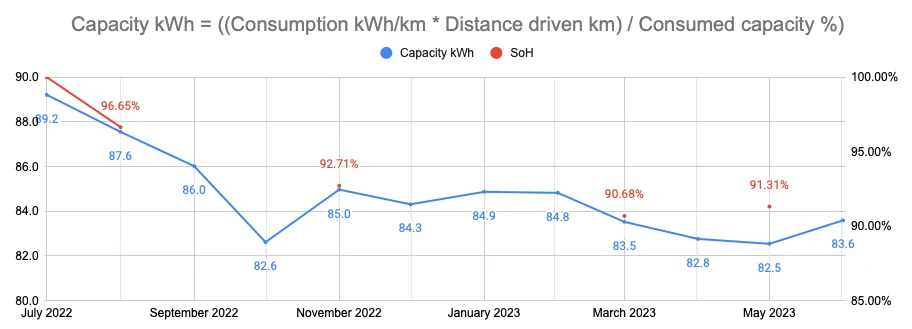
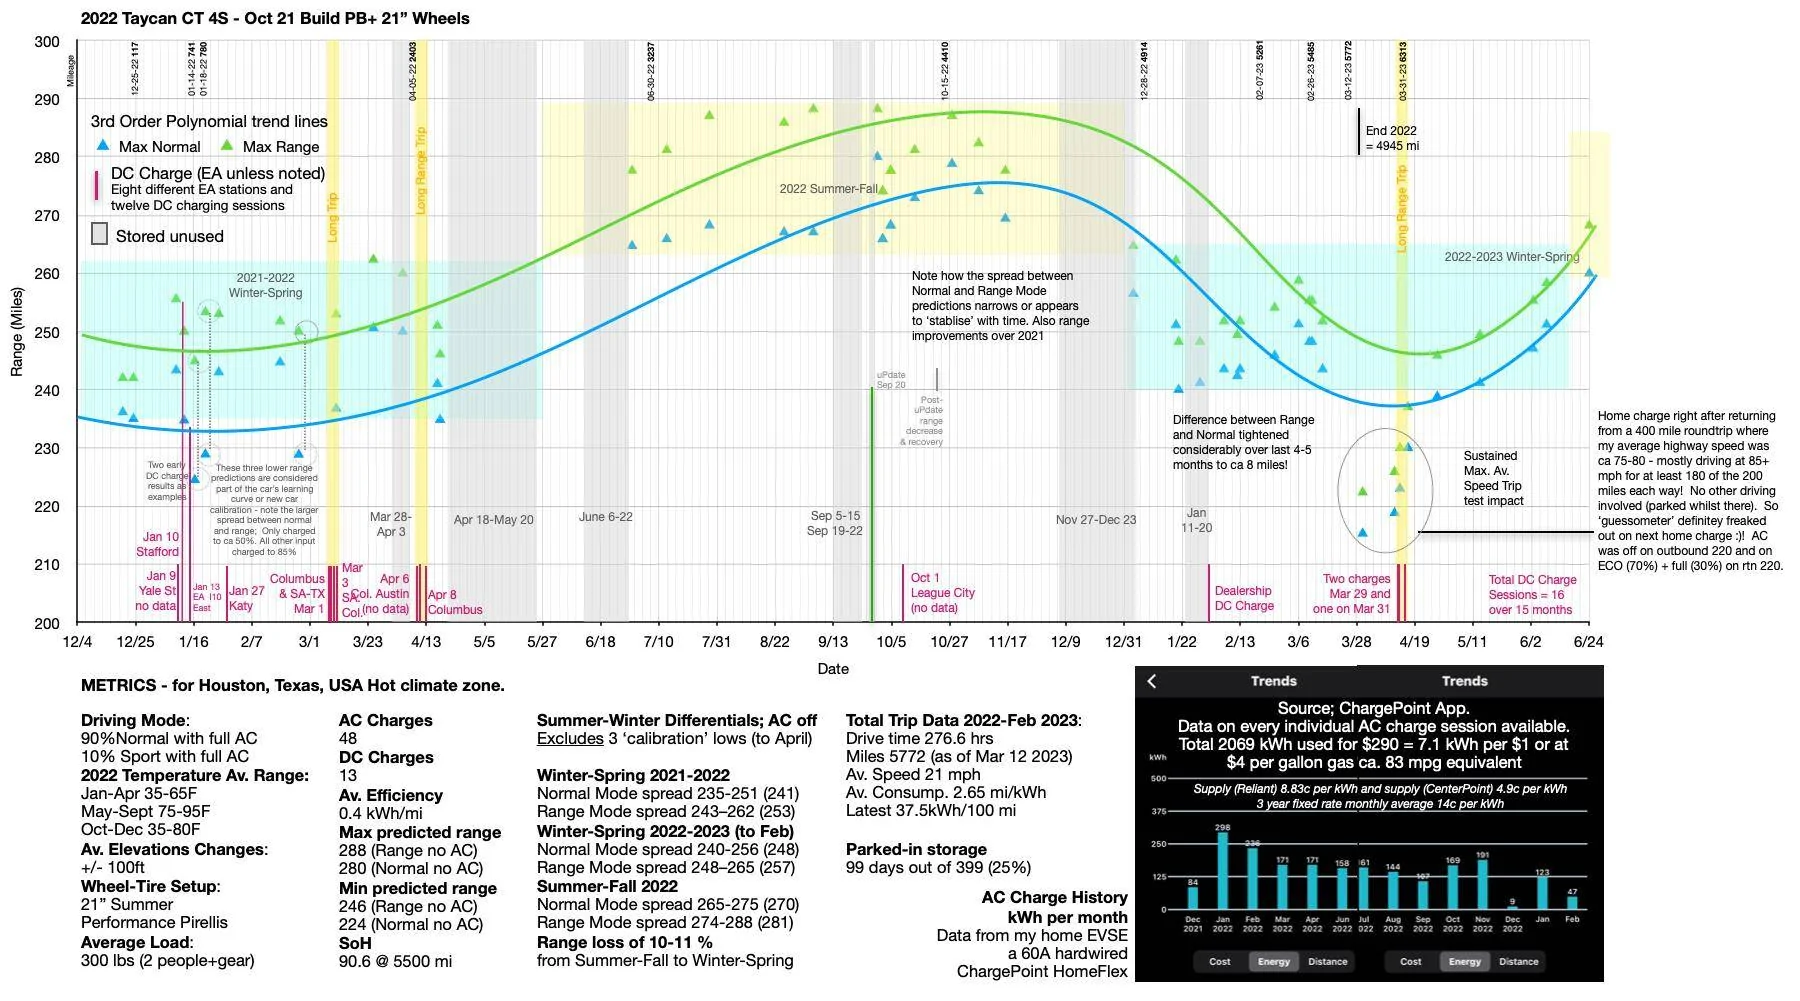
Agreed. this isn't significant.which include 7 users from a German Forum (courtesy @rs38) and a single data point from a Porsche marketing/news article. Clearly not a statistically significant sum
Sponsored
")