SergeyIndy
Well-Known Member
- First Name
- Sergey
- Joined
- Dec 19, 2021
- Threads
- 42
- Messages
- 2,472
- Reaction score
- 1,873
- Location
- Indianapolis
- Vehicles
- 23 Taycan Turbo, 24 Macan GTS ICE, 26 Macan GTS EV
@FredC057, this is really good data as I did not run mine all the way to 0%.
This is what it means:
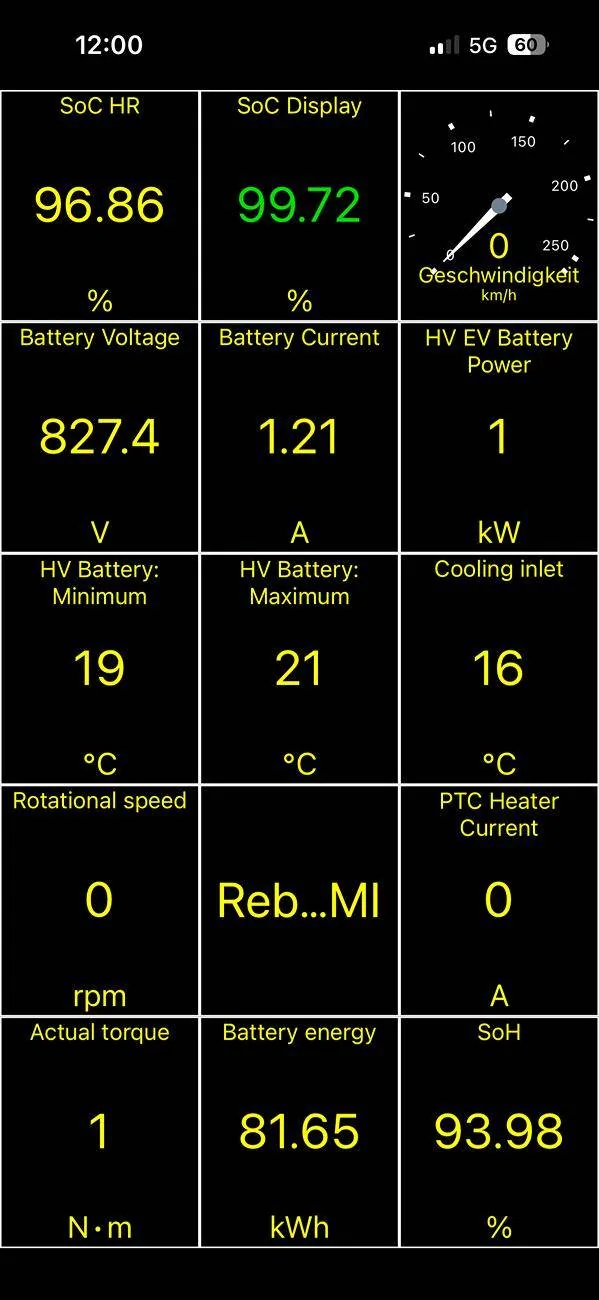
I do not know what SoC HR value means and how it varies vs other variables, but what I do know when SoC Display is 0% as in the first graph, there is some reserve in the J1.1 cars to go a few more miles, however, Battery Energy in this graph reads 0kWh, so to me this means that there is no more energy for the car to go any more, or it is simply to align with the SoC Display of 0%. Then SoC HR to me means it is pure reserve that the car can tap into for those few miles that we know others were able to go when going all the way to 0% Display SoC.
Battery Energy calculations work like this.
We know the following variable to be true for PB+ battery:
93.4kWh Gross published capacity
83.7kWh Net usable published capacity (when new)
86.7kWh Net usable actual capacity (when new) <- this is what we use in calculations
This means when the car is new you have 86.7kWh of Battery energy at 100% SoC and 100% SoH.
Then the battery starts degrading quite rapidly during the first 10k miles by as much as 10%.
Therefore, when on the last graph your Battery Energy will not be 86.7kWh anymore as you are expecting when it was new with 100% SoH, since your battery degraded now down to 87.25% SoH that translates into 86.7kWh x 87.25% SoH = 75.64kWh rounded up to 76kWh as your current usable capacity at current degradation level, so that is all the car can use when charged to 100%.
After all this the 76kWh number is what I would use to compare to consumption for quick range estimate. For example, I note how far off I am from 38kWh/100 miles consumption figure that gives me 200 miles of range. Right now, I am over that figure in -17C/1F temps so I know I am getting less than 200 miles of range, which is expected.
This is what it means:
I do not know what SoC HR value means and how it varies vs other variables, but what I do know when SoC Display is 0% as in the first graph, there is some reserve in the J1.1 cars to go a few more miles, however, Battery Energy in this graph reads 0kWh, so to me this means that there is no more energy for the car to go any more, or it is simply to align with the SoC Display of 0%. Then SoC HR to me means it is pure reserve that the car can tap into for those few miles that we know others were able to go when going all the way to 0% Display SoC.
Battery Energy calculations work like this.
We know the following variable to be true for PB+ battery:
93.4kWh Gross published capacity
83.7kWh Net usable published capacity (when new)
86.7kWh Net usable actual capacity (when new) <- this is what we use in calculations
This means when the car is new you have 86.7kWh of Battery energy at 100% SoC and 100% SoH.
Then the battery starts degrading quite rapidly during the first 10k miles by as much as 10%.
Therefore, when on the last graph your Battery Energy will not be 86.7kWh anymore as you are expecting when it was new with 100% SoH, since your battery degraded now down to 87.25% SoH that translates into 86.7kWh x 87.25% SoH = 75.64kWh rounded up to 76kWh as your current usable capacity at current degradation level, so that is all the car can use when charged to 100%.
After all this the 76kWh number is what I would use to compare to consumption for quick range estimate. For example, I note how far off I am from 38kWh/100 miles consumption figure that gives me 200 miles of range. Right now, I am over that figure in -17C/1F temps so I know I am getting less than 200 miles of range, which is expected.
Sponsored
Last edited: