Sponsored

What is your Taycan Range after X miles, Let's get some data

ciaranob

Well-Known Member
Joined
Jul 3, 2021
Threads
83
Messages
3,547
Reaction score
2,639
Location
Houston, TX
Vehicles
CT4S 2022 Mini Cooper S 2024 Electric in 2025/6
Country flag
@ciaranob , new mileage 13255mi, SoH 86.36%, and 258mi/100% with Normal Drive and Econ AC , Moderate Temp. City+Hwy driving.(Guessometer).
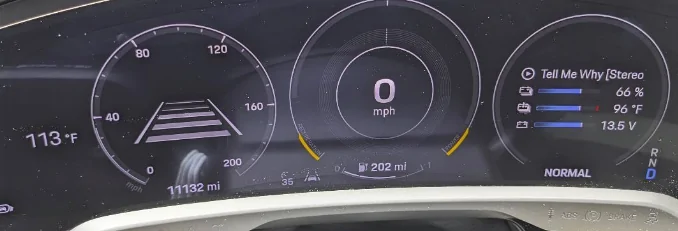
Newest data added to post #1 in baseline Soh thread - thx!
Sponsored


TXAG

Well-Known Member
First Name
Dan
Joined
Mar 9, 2022
Threads
20
Messages
533
Reaction score
526
Location
Goodyear, Arizona USA
Vehicles
2022 Taycan RWD
Country flag
After 13 months and over 11,000 miles, today I see 202 miles on the guess-o-meter at 66% SOC. That's theoretically 306 miles at 100% SOC.

2022 RWD, PB+, 20" wheels. And yeah it's been pretty hot here in the Phoenix AZ USA area for the past couple of weeks ... and it's gonna stay hot for a while.

Porsche Taycan What is your Taycan Range after X miles, Let's get some data 1689796251480

Porsche Taycan What is your Taycan Range after X miles, Let's get some data 1689796503810
 

KensingtonPark

Well-Known Member
Joined
Jul 1, 2019
Threads
21
Messages
893
Reaction score
710
Location
New York, NY
Vehicles
2020 Porsche Taycan 4S; 2023 Audi eTron S Sportbck
Country flag
Update: I charged to 100% recently. Three-year old 2020 Taycan 4S. Moderate climate.
Porsche Taycan What is your Taycan Range after X miles, Let's get some data IMG_5780
 

KensingtonPark

Well-Known Member
Joined
Jul 1, 2019
Threads
21
Messages
893
Reaction score
710
Location
New York, NY
Vehicles
2020 Porsche Taycan 4S; 2023 Audi eTron S Sportbck
Country flag
Would love to see an OBDII readout of your Soh :) Need more higher mileage cars of the database!
I do not have an OBDII reader; not even really sure what people do with them. Happy to get one if someone has a recommendation.
 
Last edited:


ciaranob

Well-Known Member
Joined
Jul 3, 2021
Threads
83
Messages
3,547
Reaction score
2,639
Location
Houston, TX
Vehicles
CT4S 2022 Mini Cooper S 2024 Electric in 2025/6
Country flag
I do not have an OBDII reader; not even really sure what people do with them. Happy to get one if someone has a recommendation.
OBDII tools provide a TON of data on your car (various models used by mechanics everywhere) pertaining to HV Battery cell status/health, a measure of Soh and basically all the systems in your car - better still all accessed via the rock sold and FREE CarScanner app available in iOS and Android app stores.

Here is a very reasonably priced unit that many have purchased on the Forum and works seamlessly with your Taycan (inbuilt profile already set up) - be aware that the PCM ALWAYS throws a fault at you when you plug this in and connect via the app - entirely normal and creates ZERO issues w.r.t. the car. Clears immediately you unplug.

Takes seconds to connect and read off your Soh.

https://www.amazon.com/stores/Vgate...ef_=ast_bln&store_ref=bl_ast_dp_brandLogo_sto
 

Packyjoon

Member
Joined
Oct 29, 2022
Threads
3
Messages
23
Reaction score
9
Location
UK
Vehicles
Lotus Exige S Roadster, Model Y
Country flag

darsh

Active Member
Joined
Jul 21, 2023
Threads
8
Messages
43
Reaction score
6
Location
Los Angeles, California
Vehicles
Taycan 4S
Country flag
Screenshot 2023-06-27 at 9.59.00 AM.png


1.5 years of data with every AC charge plotting max 'guessometer' ranges for Normal and Range modes with AC off after each charge to 85% and calculating to 100%. Car's parameters listed below.

I need to update the chart i.e. timescale slid slightly with last entries but picture fairly obvious. Good example re how your 'stye of driving' (can explain what I mean by this if needed) can massively impact the Guessometer's prediction included :)

These data have been reported in numerous threads over the last year+ and maintained/updated regularly in this thread:

https://www.taycanforum.com/forum/threads/baseline-for-hv-battery-soh-performance.12815/

Some additional outputs and graphs etc here although these charts have not been updated here since last posted:

https://www.taycanforum.com/forum/threads/charge-range-and-efficiency-one-years-data.14903/

@RTH
I would REALY like to get a SoH reading from your car - it would be the clear 'leader' for total miles driven in the chart in the first link above, so of immense interest, and to be frank, a much more interesting data point than the somewhat erratic guessometer estimates discussed here.

Do you by chance have a compatible OBDII reader - takes seconds to read out with the free CarScanner app.

Example of a compatible scanner:

https://www.amazon.com/stores/Vgate...ef_=ast_bln&store_ref=bl_ast_dp_brandLogo_sto

Wow! How did you gather/record these data? Can you please elaborate/share information on the method/source etc.? I am getting mine in November and I am curious how difficult it will be to collect some data like this.


ciaranob

Well-Known Member
Joined
Jul 3, 2021
Threads
83
Messages
3,547
Reaction score
2,639
Location
Houston, TX
Vehicles
CT4S 2022 Mini Cooper S 2024 Electric in 2025/6
Country flag
Wow! How did you gather/record these data? Can you please elaborate/share information on the method/source etc.? I am getting mine in November and I am curious how difficult it will be to collect some data like this.
Perhaps looks more impressive than it actually is :) - also, you can get a ton of actual consumptive data from the MyPorsche app (trip logs) or the web site equivalent which is always worth comparing to 'guessometer' predictions which this chart is tracking (if doing this right it may require a bit more effort i logging your trips etc) - I've shared some of mine on other threads (I'll add a link once I recall where!).

EDIT: Note that the current Electric SideCar app (developed by @featherless ) now has the ability to export all Trip Log data in CSV format - he will be adding the KWh's used etc in addl. columns which will make accessing these consumptive data even simpler than currently possible on the Porsche web site/app).

In the data I simply wanted to track the PCM's 'predicted' ranges after I charged my car - so every time I did an AC at home or DC on-the-road charge I took a pic of the end result including mileage but both for Normal mode with AC off ad Range mode with AC off - wanted to see the max. predicted ranges each would provide (this was before that uPdate software when the differences between these two was a little larger than it is now - frankly there is very little difference since the Update SW was installed). In my case too I only charge to 85% at home (100% on start of road trips) so used Soc at 85% to calculate a 100% Soc in the chart.

I then just captured the readings in a spreadsheet - super simple and very easy to keep up as minimal effort required and your phone a great record keeper - biggest result (for my use/location) really is in showing how driving style can impact (short term) results, the variation between seasonal temperatures (in Houston there are 2, hot and not so hot :)) and at least a go-by when considering longer trips as to how far you'd set a limit to recharge.

That coupled with the Soh tracking thread I started so as to compare any perceived degradation with variation in PCM predictions etc. All still early days TBH as car only 1.5 yrs and 7300 miles -I know embarrassing, need to do more log distance trips :)!
 

tchavei

Well-Known Member
Joined
Dec 3, 2022
Threads
33
Messages
1,302
Reaction score
1,369
Location
Portugal
Vehicles
Too many to list. Includes a MY23 Taycan RWD
Country flag
Doing a 1600km+ trip this week to see if I can survive with an electric vehicle in middle of high season here in Portugal. I'm mildly terrified as I see most chargers occupied 24/7. Around extra 5 million tourists to bear with. It's going to be interesting.

I'll pull a reading at the end (should have around 7k km total by that time.
 

darsh

Active Member
Joined
Jul 21, 2023
Threads
8
Messages
43
Reaction score
6
Location
Los Angeles, California
Vehicles
Taycan 4S
Country flag
Perhaps looks more impressive than it actually is :) - also, you can get a ton of actual consumptive data from the MyPorsche app (trip logs) or the web site equivalent which is always worth comparing to 'guessometer' predictions which this chart is tracking (if doing this right it may require a bit more effort i logging your trips etc) - I've shared some of mine on other threads (I'll add a link once I recall where!).

EDIT: Note that the current Electric SideCar app (developed by @featherless ) now has the ability to export all Trip Log data in CSV format - he will be adding the KWh's used etc in addl. columns which will make accessing these consumptive data even simpler than currently possible on the Porsche web site/app).

In the data I simply wanted to track the PCM's 'predicted' ranges after I charged my car - so every time I did an AC at home or DC on-the-road charge I took a pic of the end result including mileage but both for Normal mode with AC off ad Range mode with AC off - wanted to see the max. predicted ranges each would provide (this was before that uPdate software when the differences between these two was a little larger than it is now - frankly there is very little difference since the Update SW was installed). In my case too I only charge to 85% at home (100% on start of road trips) so used Soc at 85% to calculate a 100% Soc in the chart.

I then just captured the readings in a spreadsheet - super simple and very easy to keep up as minimal effort required and your phone a great record keeper - biggest result (for my use/location) really is in showing how driving style can impact (short term) results, the variation between seasonal temperatures (in Houston there are 2, hot and not so hot :)) and at least a go-by when considering longer trips as to how far you'd set a limit to recharge.

That coupled with the Soh tracking thread I started so as to compare any perceived degradation with variation in PCM predictions etc. All still early days TBH as car only 1.5 yrs and 7300 miles -I know embarrassing, need to do more log distance trips :)!

Thanks for the details and methodology :) Very useful information. Appreciate it! I will start logging/recording to see seasonal difference in range and degradation over time. I live in Los Angeles metro area and so will see some differences.
 
OP
OP
RTH

RTH

Well-Known Member
Joined
Oct 31, 2022
Threads
8
Messages
66
Reaction score
23
Location
California
Vehicles
2021 Taycan, 930, GT3, Cayenne Diesel
Country flag
Perhaps looks more impressive than it actually is :) - also, you can get a ton of actual consumptive data from the MyPorsche app (trip logs) or the web site equivalent which is always worth comparing to 'guessometer' predictions which this chart is tracking (if doing this right it may require a bit more effort i logging your trips etc) - I've shared some of mine on other threads (I'll add a link once I recall where!).

EDIT: Note that the current Electric SideCar app (developed by @featherless ) now has the ability to export all Trip Log data in CSV format - he will be adding the KWh's used etc in addl. columns which will make accessing these consumptive data even simpler than currently possible on the Porsche web site/app).

In the data I simply wanted to track the PCM's 'predicted' ranges after I charged my car - so every time I did an AC at home or DC on-the-road charge I took a pic of the end result including mileage but both for Normal mode with AC off ad Range mode with AC off - wanted to see the max. predicted ranges each would provide (this was before that uPdate software when the differences between these two was a little larger than it is now - frankly there is very little difference since the Update SW was installed). In my case too I only charge to 85% at home (100% on start of road trips) so used Soc at 85% to calculate a 100% Soc in the chart.

I then just captured the readings in a spreadsheet - super simple and very easy to keep up as minimal effort required and your phone a great record keeper - biggest result (for my use/location) really is in showing how driving style can impact (short term) results, the variation between seasonal temperatures (in Houston there are 2, hot and not so hot :)) and at least a go-by when considering longer trips as to how far you'd set a limit to recharge.

That coupled with the Soh tracking thread I started so as to compare any perceived degradation with variation in PCM predictions etc. All still early days TBH as car only 1.5 yrs and 7300 miles -I know embarrassing, need to do more log distance trips :)!
Interestingly, my SoH (OBD reading) is inching up after I stopped using DC exclusively and started using level 2 home charging twice from <20% to 80%. SoH went from 85.85% to 87.63%.
 

ciaranob

Well-Known Member
Joined
Jul 3, 2021
Threads
83
Messages
3,547
Reaction score
2,639
Location
Houston, TX
Vehicles
CT4S 2022 Mini Cooper S 2024 Electric in 2025/6
Country flag
Interestingly, my SoH (OBD reading) is inching up after I stopped using DC exclusively and started using level 2 home charging twice from <20% to 80%. SoH went from 85.85% to 87.63%.
Excellent and def some papers/research out there that suggests dominant use of DC charging (and in particular in warmer climates) can be detrimental to the battery health/longevity. But just for ref too, be aware that most of us tracking SoH are seeing +/- 1-2% variations from the OBDII flash readings either due to abrupt changes in driving style/dynamics/trips, seasonal (winter-summer) av temp changes etc. Good to track though.

Hey last SoH reading I had from you was 86.4 at ca 13255 miles - so you've taken at least two readings since :) - can you add rough mileages to the 85.85 and 87.63 readouts so I can add to the plot?

Thx, C.
 
OP
OP
RTH

RTH

Well-Known Member
Joined
Oct 31, 2022
Threads
8
Messages
66
Reaction score
23
Location
California
Vehicles
2021 Taycan, 930, GT3, Cayenne Diesel
Country flag
Excellent and def some papers/research out there that suggests dominant use of DC charging (and in particular in warmer climates) can be detrimental to the battery health/longevity. But just for ref too, be aware that most of us tracking SoH are seeing +/- 1-2% variations from the OBDII flash readings either due to abrupt changes in driving style/dynamics/trips, seasonal (winter-summer) av temp changes etc. Good to track though.

Hey last SoH reading I had from you was 86.4 at ca 13255 miles - so you've taken at least two readings since :) - can you add rough mileages to the 85.85 and 87.63 readouts so I can add to the plot?

Thx, C.
New mileage---13678.
Sponsored


Top