Sponsored

🔋 Baseline for HV Battery SoH Performance (Battery Degradation Data by Taycan Owners)

OP
OP
ciaranob

ciaranob

Well-Known Member
Joined
Jul 3, 2021
Threads
83
Messages
3,547
Reaction score
2,639
Location
Houston, TX
Vehicles
CT4S 2022 Mini Cooper S 2024 Electric in 2025/6
Country flag
re-did one today (from 8% to 85% - AC 22kW - 43080km). new SoH : 92.33.
That is +3% compared to a couple of weeks ago.
Weather conditions were the same (temp. / humidity)

Screenshot_20231120-133332.png
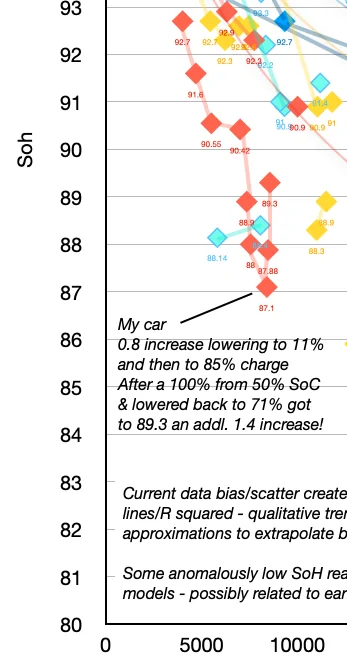
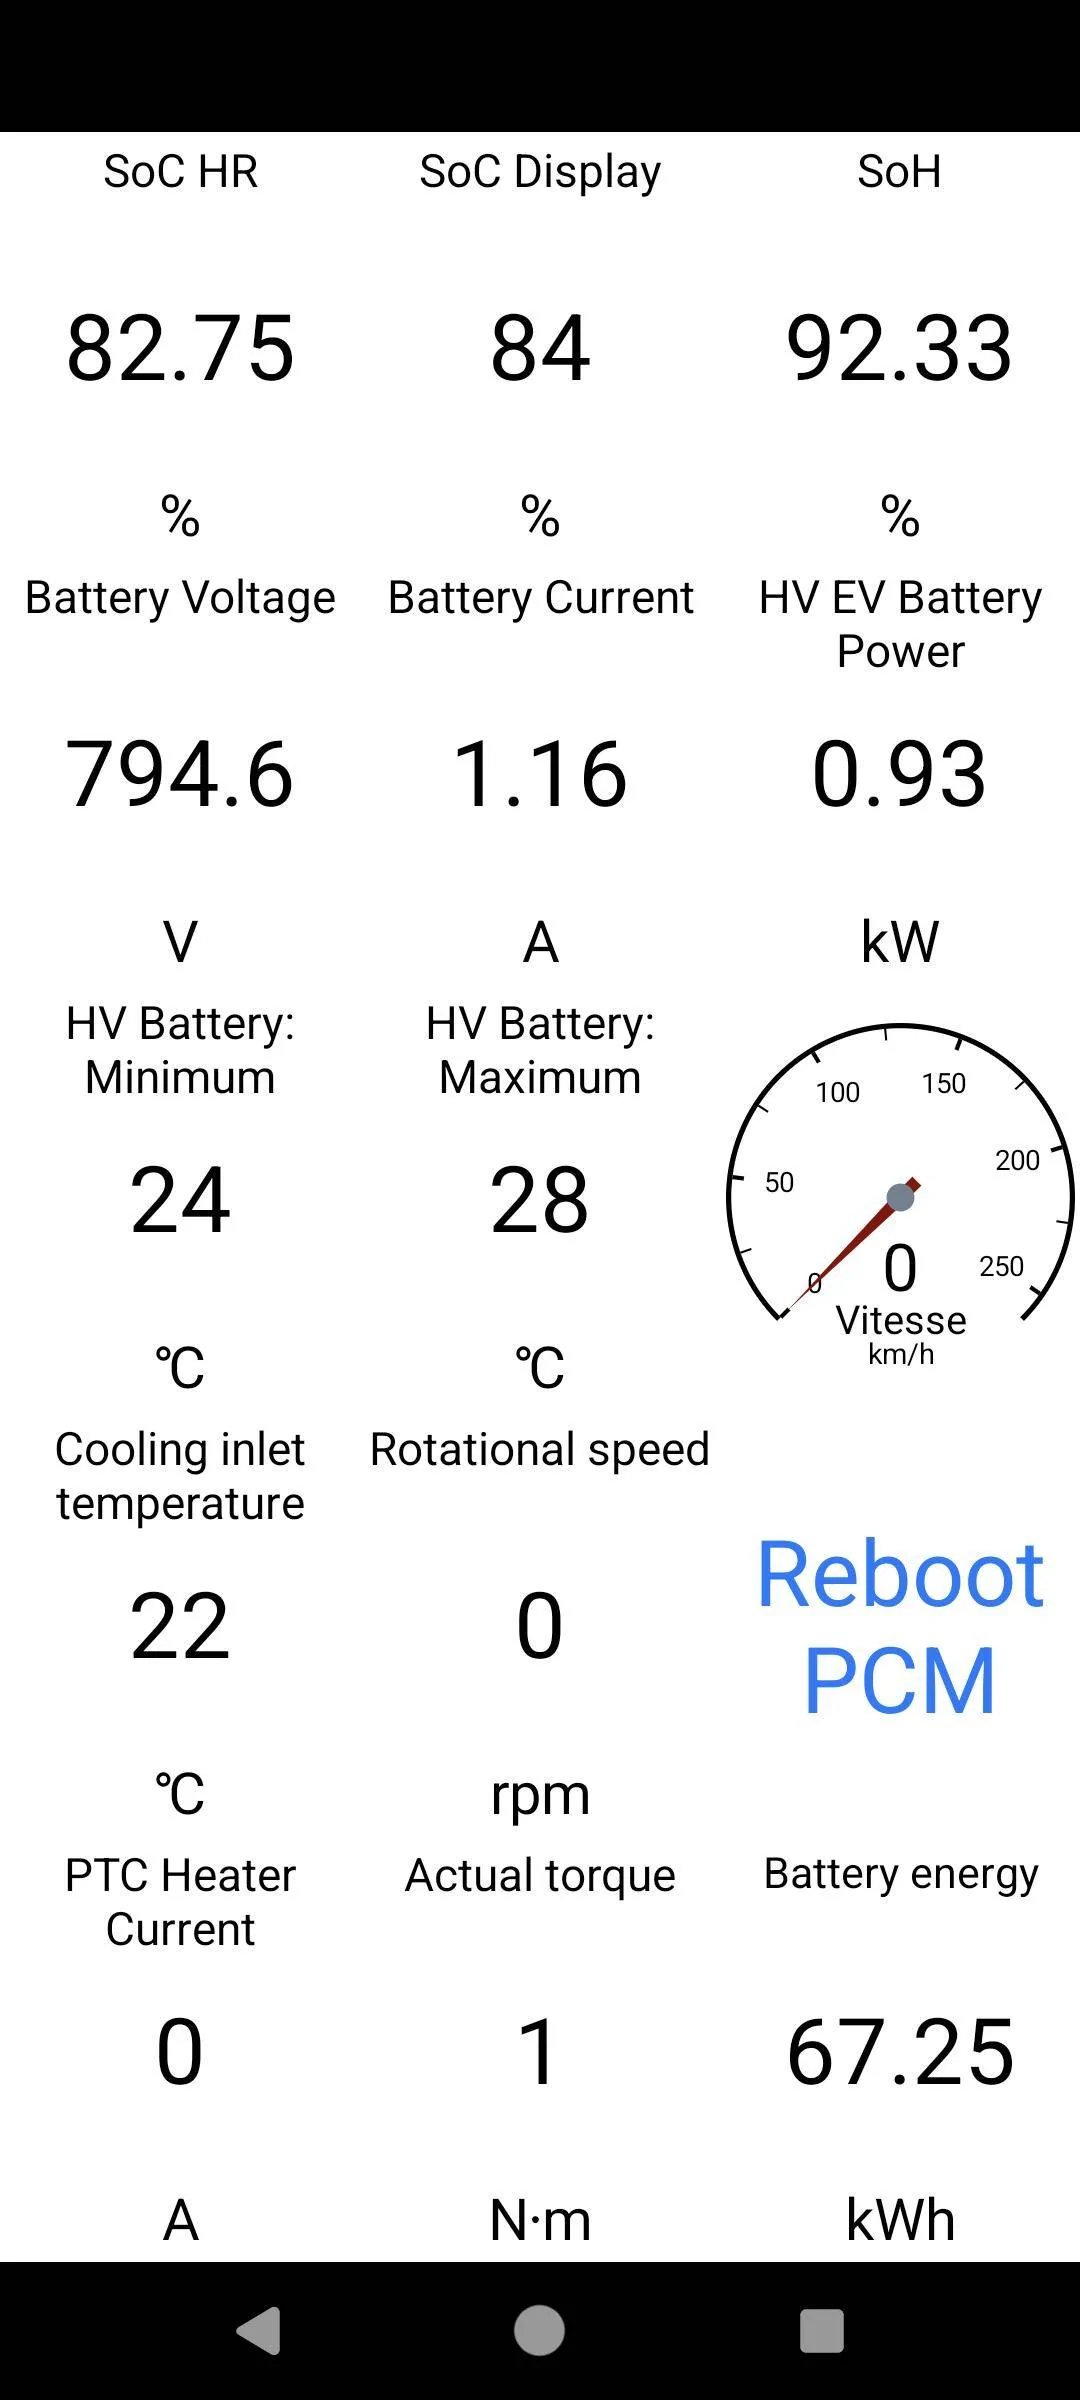
Impressive - mine still pending as not had a chance to burn off enough yet!
Sponsored


Vim Schrotnock

Well-Known Member
First Name
Vim
Joined
Oct 20, 2018
Threads
37
Messages
1,270
Reaction score
1,888
Location
Cincinnati
Vehicles
GTB1 Race Cayman, Taycan Turbo S
Country flag
My understanding according to the Porsche Battery specialist they flew in from Atlanta is that actual SOH readings take two days and are quite extensive. The OBD readings are not accurate. They measured my SOH at 92.6%, but the OBD measurement on the same day, and for weeks prior was consistently 90.3%. Then it read 91.57 for several weeks, and was as high as 92.33 for one measurement.
 
Last edited:
OP
OP
ciaranob

ciaranob

Well-Known Member
Joined
Jul 3, 2021
Threads
83
Messages
3,547
Reaction score
2,639
Location
Houston, TX
Vehicles
CT4S 2022 Mini Cooper S 2024 Electric in 2025/6
Country flag
My understanding according to the Porsche Battery specialist they flew in from Atlanta is that actual SOH readings take two days and are quite extensive. The OBD readings are not accurate. They measured my SOH at 92.6%, but the OBD measurement on the same day, and for weeks prior was consistently 90.3%. Then it read 91.57 for several weeks, and was as high as 92.33 for one measurement.
As pointed out many, many times in this thread, the OBDII tool and the PIWIS dealership flash readings (which are identical in respect how and what they read and) are again within +/- 2 pts of the actual full diagnostic SoH from a multi-day deep assessment test (as shared by three separate members to date).

Sorry but a bit frustrating to have to keep repeating this - so to my opinion, the OBDII reading are in fact remarkably close to the 'actual' Soh and remember, again, this is what your dealership will use initially to assess if you have met warranty requirements for a replacement battery. They of course will undoubtedly proceed at that point to likely perform a proper deep test to validate the Soh value.
 

Vim Schrotnock

Well-Known Member
First Name
Vim
Joined
Oct 20, 2018
Threads
37
Messages
1,270
Reaction score
1,888
Location
Cincinnati
Vehicles
GTB1 Race Cayman, Taycan Turbo S
Country flag
I guess your definition of accuracy depends on what you're using the SOH measurements for. For instance, I was hoping to see a trend in upward/downward SOH using the OBD and this just isn't really practical. My actual SOH on the day the dealer completed measuring was 92.6%. I took an OBD reading immediately before and after that and both indicated a 90.3 SOH, a difference of 2.3 points. What is important is the range that we are operating in, which is 80-100% SOH, with the vast majority in about a 10 point spread in the high 80's to 90's. If you're monitoring readings within this range, that's fine, but they are not accurate, they are indicative. I've seen basically the same battery move around almost 40% within this range and have no idea if it's the measurement device or the battery.

More importantly the readings are not just inaccurate, they are not even relatively accurate, one reading high on one day, then down the next day. If you read 92 one day, and later 93, and later 94, you would assume that something is happening to cause the SOH to improve. You can't make this conclusion with the inaccuracy of the OBD measuremnt. The whole point for me in getting measurements over a period of time of something is to evaluate how it is performing. The only real use I can see for the OBD SOH is to indicate when the SOH has dropped significantly. The OBD SOH is a good indication, but let's not confuse this with an accurate measurement of the SOH of the battery.


Tooney

Well-Known Member
Joined
Aug 14, 2021
Threads
746
Messages
4,471
Reaction score
3,651
Location
Ohio
Vehicles
2022 Taycan 4S
Country flag
IMore importantly the readings are not just inaccurate, they are not even relatively accurate, one reading high on one day, then down the next day. If you read 92 one day, and later 93, and later 94, you would assume that something is happening to cause the SOH to improve. You can't make this conclusion with the inaccuracy of the OBD measuremnt. The whole point for me in getting measurements over a period of time of something is to evaluate how it is performing. The only real use I can see for the OBD SOH is to indicate when the SOH has dropped significantly. The OBD SOH is a good indication, but let's not confuse this with an accurate measurement of the SOH of the battery.
Perhaps the SOH value being measured by OBD (or Porsche PIWIS, or during "deep test") actually varies over time (due to changes in temperature, SOC, other physical variables, measurement error, etc..). The measurements may still be accurate. Variation - high one day, down next day - does not necessarily mean the readings are inaccurate.

Whether the measurements are useful for your purpose is a different matter than whether they are "accurate".
 
OP
OP
ciaranob

ciaranob

Well-Known Member
Joined
Jul 3, 2021
Threads
83
Messages
3,547
Reaction score
2,639
Location
Houston, TX
Vehicles
CT4S 2022 Mini Cooper S 2024 Electric in 2025/6
Country flag
I guess your definition of accuracy depends on what you're using the SOH measurements for. For instance, I was hoping to see a trend in upward/downward SOH using the OBD and this just isn't really practical. My actual SOH on the day the dealer completed measuring was 92.6%. I took an OBD reading immediately before and after that and both indicated a 90.3 SOH, a difference of 2.3 points. What is important is the range that we are operating in, which is 80-100% SOH, with the vast majority in about a 10 point spread in the high 80's to 90's. If you're monitoring readings within this range, that's fine, but they are not accurate, they are indicative. I've seen basically the same battery move around almost 40% within this range and have no idea if it's the measurement device or the battery.

More importantly the readings are not just inaccurate, they are not even relatively accurate, one reading high on one day, then down the next day. If you read 92 one day, and later 93, and later 94, you would assume that something is happening to cause the SOH to improve. You can't make this conclusion with the inaccuracy of the OBD measuremnt. The whole point for me in getting measurements over a period of time of something is to evaluate how it is performing. The only real use I can see for the OBD SOH is to indicate when the SOH has dropped significantly. The OBD SOH is a good indication, but let's not confuse this with an accurate measurement of the SOH of the battery.
Could not disagree more with your comments - the OBDII readings (validated against Porsche's own PIWIS measurements) are within 1-2% accuracy of full battery cycle testing (of which we have 5 cars used to measure against to date). So they most definitely are more than 'relatively accurate'.

I (and the vast majority of folk here I suspect) are not interested in a day to day variation - as has been discussed ad nauseam here, we are entirely aware of the variables that influence a 1 to 2 pt. variance in Soh readings - just not an issue for anyone here - this thread on baseline Soh is all about long term trends (months to years) in Soh and more specifically about local climate conditions and how that can impact longer term battery degradation.

Data trends from 66 cars from every climate zone worldwide are showing remarkably consistent long term trends in (relative as measured by OBDII) Soh. But indeed, if your concern is all about a +/- 1-2% day to day variation, then no worries but an entirely pointless concern imo.
 
Last edited:

Vim Schrotnock

Well-Known Member
First Name
Vim
Joined
Oct 20, 2018
Threads
37
Messages
1,270
Reaction score
1,888
Location
Cincinnati
Vehicles
GTB1 Race Cayman, Taycan Turbo S
Country flag
Could not disagree more with your comments - the OBDII readings (validated against Porsche's own PIWIS measurements) are within 1-2% accuracy of full battery cycle testing (of which we have 5 cars used to measure against to date). So they most definitely are more than 'relatively accurate'.

I (and the vast majority of folk here I suspect) are not interested in a day to day variation - as has been discussed ad nauseam here, we are entirely aware of the variables that influence a 1 to 2 pt. variance in Soh readings - just not an issue for anyone here - this thread on baseline Soh is all about long term trends (months to years) in Soh and more specifically about local climate conditions and how that can impact longer term battery degradation.

Data trends from 66 cars from every climate zone worldwide are showing remarkably consistent long term trends in (relative as measured by OBDII) Soh. But indeed, if your concern is all about a +/- 1-2% day to day variation, then no worries but an entirely pointless concern imo.
I don't want to get into an argument with you, or others on this forum who have been incredibly helpful to me in a wide variety of areas. I also won't get into my experience, education and relevant backround in this area, because none of that makes me correct in whatever opinion I might have.

I will continue to report on actual firsthand data and conversations that I have had with experts on whatever topics I feel are relevant to this forum. My data on the SOH measurement is that I had a measurement done by one of the 11 certified Porsche battery technicians in the US, and the result was a SOH of 92.6%. My OBD measured 90.3% directly before and after this expert measurement. I've taken OBD SOH measurements pretty much every day for one month since then, and the values have ranged from a low of 90.3 to a high of 91.6%. These are facts, and at this point, I'll remove myself from any discussion on the interpretation of these facts.
 
Last edited:


OP
OP
ciaranob

ciaranob

Well-Known Member
Joined
Jul 3, 2021
Threads
83
Messages
3,547
Reaction score
2,639
Location
Houston, TX
Vehicles
CT4S 2022 Mini Cooper S 2024 Electric in 2025/6
Country flag
I don't want to get into an argument with you, or others on this forum who have been incredibly helpful to me in a wide variety of areas. I also won't get into my experience, education and relevant backround in this area, because none of that makes me correct in whatever opinion I might have.

I will continue to report on actual firsthand data and conversations that I have had with experts on whatever topics I feel are relevant to this forum. My data on the SOH measurement is that I had a measurement done by one of the 11 certified Porsche battery technicians in the US, and the result was a SOH of 92.6%. My OBD measured 90.3% directly before and after this expert measurement. I've taken OBD SOH measurements pretty much every day for one month since then, and the values have ranged from a low of 90.3 to a high of 91.6%. These are facts, and at this point, I'll remove myself from any discussion on the interpretation of these facts.
Well I'm going to bet I can match whatever level of education you are referring to but why bring that up? So you've simply re-iterated your personal focus on a +/- 1-2% variation in Soh which you have measured as you say, daily. You seem to miss the point being made here re long term trends but that's OK.

We've had 5 cars do the exact same test of OBDII prior and after a full cycle test and the max variance observed to date was less than 2% - entirely acceptable in respect the use of OBDII data in this thread - yours at 2.3% would be the highest. Three of the tests had less than 0.5% difference.

For the purpose of this thread, that is, again long term trends for example in respect how quickly we get to warranty 80% Soh at 3 yrs etc., and/or mapping trend variations between climate zones knowing full well that there is a now well documented +/- 1-2%+ variance between readings - is the point. 1-2% NBD and in the noise.

PS: Curious as to whether that full test was done on your battery with the faulty cells or the repaired (or replaced?) battery?
 
OP
OP
ciaranob

ciaranob

Well-Known Member
Joined
Jul 3, 2021
Threads
83
Messages
3,547
Reaction score
2,639
Location
Houston, TX
Vehicles
CT4S 2022 Mini Cooper S 2024 Electric in 2025/6
Country flag
OK - finally got around to doing some battery 'cycling' but not ideal i.e. ran then car down to ca 10% and recharged to 85% with Soh before and after - then had a couple of days before I charged to 100% from ca 50%, then (after overnight in garage,) ran the car back to ca 70% SoC with another Soh reading after.

The good news is that, as others have reported it seems fairly consistently, my Soh climbed in two steps back to 89.28. The first jump added 0.8 after charging from 10 to 85%. The second jump of 1.4 after charging to 100% and driving back to 70%. This simple process is effectively 're-setting' or 're-balancing' the battery cells (a number of chemical, physical, lag factors involved) - to date 5 cars I am aware of have seen small to decent resets all in or about +/- 2% - my cumulative add was 2.2 which for me is great i.e. the car is now more inline with other cars in my climate zone (I was previously the worst performer).

I'll continue to play with this over next few months but the initial concern that I was torpedoing straight to 80% in under three years has lessened :)!

Zoomed in view of my car's Soh history (lower set of red diamonds):

Porsche Taycan 🔋 Baseline for HV Battery SoH Performance (Battery Degradation Data by Taycan Owners) Screenshot 2023-12-03 at 9.07.50 AM
 

tbinmd

Well-Known Member
Joined
Oct 11, 2021
Threads
0
Messages
569
Reaction score
426
Location
Maryland
Vehicles
CT4, 991.2 GT3
Country flag
Today marks 2 years that we took delivery of my wife's 22 CT4. Pulled the battery data (didn't realized I've had an OBDII dongle that would work with car scanner and the Taycan... Doh!!!)

88.14% SoH. with 15941 miles. We've only fast charged a 2-3 times otherwise always charge at home (50 amp circuit) to 85%. A few times to 100% for long trips.

Porsche Taycan 🔋 Baseline for HV Battery SoH Performance (Battery Degradation Data by Taycan Owners) ctscan3 - 1 (1)
 

SergeyIndy

Well-Known Member
First Name
Sergey
Joined
Dec 19, 2021
Threads
41
Messages
2,448
Reaction score
1,832
Location
Indianapolis
Vehicles
24 Macan GTS, 23 Taycan Turbo, 20 Cayenne Turbo
Country flag
I am not intending to create noise by posting every 500 miles, so please choose to exclude any of my data points. This data point is interesting since after the latest software update SOH has increased for the first time since I started measuring and I double checked the data to make sure no typos.

November 14, 2023:
* APB2 recall battery sealant test passed
* WPN9 update applied at the same time

1) Delivery SoH = 99.95% (Measured July 1, 2023)
2) Current SoH = 94.87% (Measured November 19, 2023) increased by 0.51 since last 500 miles
3) Current mileage = 2,527
4) Home charging at 11kW from typically 10%-15% to 85%
5) Build date April 2023
1) Delivery SoH = 99.95% (Measured July 1, 2023)
2) Current SoH = 95.12% (Measured Dec 10, 2023)
3) Current mileage = 3,000
4) Home charging at 11kW from typically 10%-15% to 85%
5) Build date April 2023
 
OP
OP
ciaranob

ciaranob

Well-Known Member
Joined
Jul 3, 2021
Threads
83
Messages
3,547
Reaction score
2,639
Location
Houston, TX
Vehicles
CT4S 2022 Mini Cooper S 2024 Electric in 2025/6
Country flag
Today marks 2 years that we took delivery of my wife's 22 CT4. Pulled the battery data (didn't realized I've had an OBDII dongle that would work with car scanner and the Taycan... Doh!!!)

88.14% SoH. with 15941 miles. We've only fast charged a 2-3 times otherwise always charge at home (50 amp circuit) to 85%. A few times to 100% for long trips.

ctscan3 - 1 (1).webp
Thx for sharing - I'll def add to spreadsheet/plot tomorrow - just for ref though, depending on a whole host of factors you might see a decent up-tick in your Soh if you can perform a 'soft reset' of your battery pack.

If you can try to run the SoC done to ca 10% or lower, take an Soh reading and then recharge to minimum of 85% - preferably up to 100% - but if you do 100%, you'll need to be sure to run the car very shortly after to burn min. 25% of that 100% SoC. Ideally try to run your SoC down to ca. 50% before recharging.

Then charge the car back to ca 85% (or even to 100% but again don't leave it long in this state) and take another OBDII reading.

When I did this last I got a 2+% Soh bump - most who have done similar got at least a 1% bump.

You're essentially 'rebalancing' your battery cells chem to an optimal state with a more accurate current Soh readout.

Cheers, C.
 
OP
OP
ciaranob

ciaranob

Well-Known Member
Joined
Jul 3, 2021
Threads
83
Messages
3,547
Reaction score
2,639
Location
Houston, TX
Vehicles
CT4S 2022 Mini Cooper S 2024 Electric in 2025/6
Country flag
Time for another reading

14209km
91.31%

?
Thx - uploaded to Post #1 charts - btw added +/- 2% pt 'error' i.e. range bars to illustrate measured Soh variations reported by a number of us to date.
Sponsored


Top